For the fourth edition of the computer version of Harpoon (CH 4 ) a basic, but dynamic, radar model is proposed. Rather than calculating the range on a case-by-case basis using the radar equation, each radar will be assigned a basic performance value (BPV) that represents all of the system dependent inputs. The only variables that will be dynamic will be the target's radar cross section and environmental issues, such as clutter and attenuation. The basic range equation itself is based on the Blake Chart 1 method where individual dB values for the BPV, clutter, clutter rejection, attenuation, ECM and other factors are summed and then put into a power of ten function to provide the systems detection range. The fundamental radar range equation is given below:
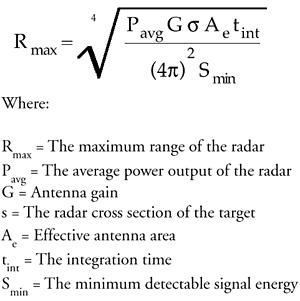
The Basic Performance Value (BPV) of a radar is equal to all of the above terms, less the radar cross section (rcs) of the target.
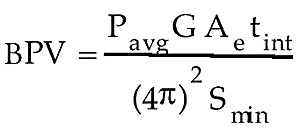
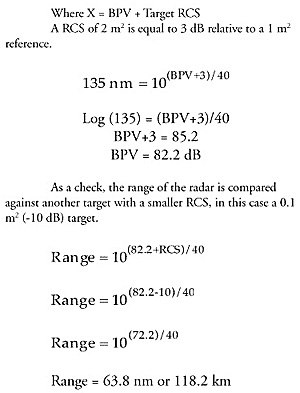
Using the Blake Chart method of calculating radar performance, all the various "dB" terms are added together and then inserted into a power of ten function to provide the systems detection range. If a system's range for a specific RCS is known, the BPV can be determined for that radar.
Example: The Signal LW 09 is a 2D air search radar with a rated range of 250 km (135 nm) against a 2 meter square target. The BPV of this system is calculated as follows:
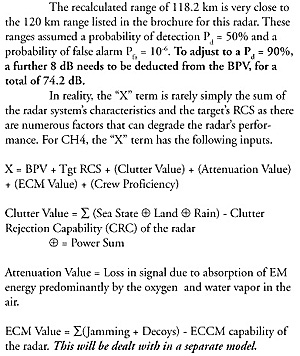
Crew Proficiency = How well the crew can operate its equipment.
Target RCS Value
The RCS of ships is directly proportional to the log (base 10) of its displacement. Since ships are quite large and have numerous reflecting surfaces, the RCS signature of ships is not particularly aspect dependent. From what sources I have, there is at most a 4-5 dB difference between a narrow aspect and a broad aspect ship. Thus, the model assumes that the RCS of a ship is uniform with aspect. To determine a ship's RCS, merely insert the normal displacement, or surface displacement for submarines, into the following equation.
Example: A US Nimitz Class CVN has a normal displacement of 81,600 tons. This gives a RCS of 67 dB - the bloody broad side of the proverbial barn! A ship's RCS can be reduced in much the same way as an aircraft. The primary method is by shaping, with RAM being used to either knock down particular highlights or to reduce the RCS a little more. By far and away, the greatest reduction comes from angling the ship's hull and superstruc-ture. For evaluation purposes, there are three general categories of hull shaping: Slight, Moderate, and Radical. The ranges of angles, angle of the hull and/or superstructure, and the RCS reduction value are listed in the table below.
| Shaping Term | Range of Angles | RCS Reduction Factor | RCS (dB) |
|---|---|---|---|
| Slight | 5° - 15° | 0.1 | -10 |
| Moderate | 16° - 30° | 0.02 | -17 |
| Radical | 31° - 45° | 0.005 | -23 |
RAM, if applied to the majority of the superstructure, has a RCS reduction factor of -7 db. The resulting modified RCS is returned to dB for through the following equation:
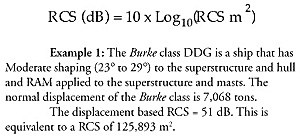
Example 1: The Burke class DDG is a ship that has Moderate shaping (23° to 29°) to the superstructure and hull and RAM applied to the superstructure and masts. The normal displacement of the Burke class is 7,068 tons. The displacement based RCS = 51 dB. This is equivalent to a RCS of 125,893 m 2 . The Shaping Reduction Factor = -17 for Moderate shaping
RAM Reduction Factor = -7
The modified RCS = 51 - 17 - 7.
This is equal to a RCS of 27 dB
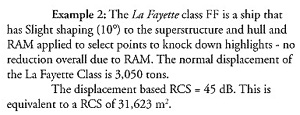
The Shaping Reduction Factor = -10 for Slight shaping
RAM Reduction Factor = 0
The modified RCS = 45 - 10 - 0
This is equal to a RCS of 35 dB
Unlike ships, aircraft do not have a nice neat equation to provide the RCS, and they exhibit a significant aspect dependency. Hence, the assignment of RCS to aircraft will be far more subjective. The table below provides some guidelines on assigning RCS to various aircraft. Of note, these values are for a nose-on aspect.
| Aircraft | H4 Size Rating | CH 4 Size Rating | RCS |
|---|---|---|---|
| B-52 | Large | VLarge | +25 dB |
| Tu-95 | Large | VLarge | +21 dB |
| P-3 | Large | VLarge | +20 dB |
| Tu-16 | Large | Large | +16 dB |
| 707 | Large | Large | +16 dB |
| F-15 | Large | Medium | +10 dB |
| F-4 | Large | Medium | +10 dB |
| B-1B | Small | Medium | +8 dB |
| MiG-21 | Small | Small | +6 dB |
| F-16 | Small | Small | +5 dB |
| Cessna 180 | Small | VSmall | +2 dB |
| F-18E/F | VSmall | Low Observable | -10 dB |
| Rafael | VSmall | Low Observable | -10 dB |
| Tomahawk* | Stealthy | Very Low Observ | -20 dB |
| F-117 | Stealthy | Ultra Low Observ | -32 dB |
| B-2 | Stealthy | Ultra Low Observ | -37 dB |
| * = Cruise missile | |||
With this list of aircraft, a generic size rating versus RCS chart can be constructed:
| CH4 Size Rating | CH4 RCS Value |
|---|---|
| Very Large | +25 dB |
| Large | +15 dB |
| Medium | +10 dB |
| Small | + 5 dB |
| Very Small | 0 dB |
| Low Observable | -10 dB |
| Very Low Observable | -25 dB |
| Ultra Low Observable | -40 dB |
To account for the aspect dependency, two linear equations are used to describe how an aircraft's RCS varies as the aspect angle increases. These equations assume that the broadside (90°) RCS is 10 dB higher than the nose-on RCS and that the stern aspect is about 5 dB less than broadside.
For aspect angles from 0° to 90° the equations is:
- RCS(Angle) = 0.111(Aspect Angle) + Nose RCS
For aspect angles from 91° to 180° the equations is:
- RCS(Angle) = -0.056(Aspect Angle - 90) + Broad RCS
Clutter Value
Radar clutter are extraneous echoes from objects that are not desirable targets. The radar detects clutter, but it only interferes with the detection of true targets. Clutter is caused by the scattering of radar energy from land, sea surface, rain, birds and insects. In this model, only the first three are dealt with and only then in a generalized way. Clutter is one of the hardest things to model accurately in radar analysis. The values in the table below are in dB.
| Clutter Type | SS - Radar Ship | AS - Radar Ship | FC - Radar Ship | SS and AI - Radar Aircraft |
|---|---|---|---|---|
| Land | ||||
| Flatland/Beach | -17 | -25 | -23 | -42 |
| Flat w/Lt Bush | -21 | -29 | -27 | -47 |
| Wooded Area | -27 | -35 | -33 | -52 |
| Hills/Cities | -29 | -37 | -35 | -54 |
| Mountains | -33 | -41 | -39 | -58 |
| Sea Surface | ||||
| Sea State 1 | -4 | -12 | -10 | -29 |
| Sea State 2 | -5 | -13 | -11 | -30 |
| Sea State 3 | -6 | -14 | -12 | -31 |
| Sea State 4 | -7 | -15 | -13 | -32 |
| Sea State 5 | -8 | -16 | -14 | -33 |
| Sea State 6 | -9 | -17 | -15 | -34 |
| Sea State 7 | -10 | -18 | -16 | -35 |
| Sea State 8 | -11 | -19 | -17 | -36 |
| Sea State 9 | -12 | -20 | -18 | -37 |
| Rain | ||||
| Lt Drizzle | 0 | 0 | 0 | -5 |
| Hvy Drizzle | -1 | -7 | -7 | -15 |
| Sprinkle | -6 | -11 | -11 | -20 |
| Light Rain | -13 | -18 | -18 | -27 |
| Moderate Rain | -22 | -27 | -27 | -23 |
| Heavy Rain | -29 | -35 | -34 | -43 |
| Torrential Rain | -38 | -43 | -43 | -52 |
While this table may look somewhat foreboding, please realize that all other radars can be expressed as a modifica-tion to the basic shipboard SS radar. The land and sea surface clutter modifiers only affect an AS radar that is looking for a target in the VLow altitude band. Rain clutter affects an AS radar at all altitude bands. If a surface duct is present, than the land and/or sea surface clutter is increased by -8 dB.
| Land Clutter Equations | Sea Surface Clutter Equations | Rain Clutter Equations |
|---|---|---|
| AS-Ship = SS - 8 | AS-Ship = SS - 8 | AS-Ship = SS - 5 |
| FCS = SS - 6 | FCS = SS - 6 | FCS = SS - 5 |
| A/C = SS - 25 | A/C = SS - 25 | A/C = SS - 14 * |
| except for Lt Drizzle which is -5. | ||
Clutter Rejection
As one can see from the table above, clutter can significantly reduce the detection range of a radar. To mitigate the impact of clutter, various processing techniques, usually doppler and pulse compression routines, are used to reject the unwanted echoes. For air search radars, Moving Target Indicator (MTI) is the preferred method. This technique uses the target's doppler to distinguish it from the background clutter which isn't moving. MTI does require a minimum speed, however, in order to be effective. Therefore, MTI can only be used on targets traveling faster than 60 knots. Surface search radars typically use pulse compression (PC), but this isn't as effective as MTI. The MTI improvement factor of many radars is available in open source and is a measure of the system's clutter rejection capability. This model assumes there is a 6 dB reduction in the claimed MTI value to account for system losses. [Each radar that has MTI or PC techniques will have a value listed in the clutter rejection portion of the data input.]
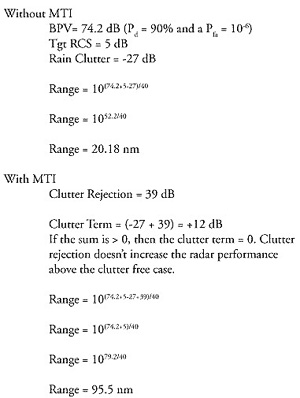
Example: The LW 09 has a listed MTI improvement factor of 45 dB. This is reduced to 39 dB after the loss term is applied. If this radar attempts to detect a small fighter (RCS=5 dB) in moderate rainfall (Clutter = -27 dB) with and without MTI, the range would be.
Attenuation
Attenuation is the loss of EM energy as it is absorbed and converted to heat by the Oxygen and water vapor in the air. Since many radar performance values use a free space assumption, the loss due to attenuation must be inserted. This is done in a three-step process. First calculate the range as done in the example above, then multiply that range by the attenuation coefficient to obtain the dB loss due to attenuation. Subtract this number from the 'X" term of the first calculation and recalculate the range with the attenuation affects included. The attenuation coefficients (dB/nm) are as follows:
| Condition SS | Atten Coeff AS | Atten Coeff |
|---|---|---|
| Clear | 0.013 | 0.008 |
| Lt Drizzle | 0.015 | 0.008 |
| Hvy Drizzle | 0.018 | 0.008 |
| Sprinkle | 0.035 | 0.009 |
| Lt Rain | 0.072 | 0.01 |
| Moderate Rain | 0.256 | 0.017 |
| Hvy Rain | 0.95 | 0.035 |
| Torrential | 2.81 | 0.099 |
Example: In the last example, the LW 09 had an "X" term of 79.2 dB with clutter rejection, which gave a range of 95.5 nm. The attenuation coefficient for an AS radar in moderate rain is 0.017 dB/nm.
Atten Loss = 95.5 x 0.017
Atten Loss = 1.62 dB
Revised "X" term = 79.2 - 1.6 = 77.6
New Range = 10 to the 77.6/40 power
New Range = 87.1 nm
Crew Proficiency
Radars, like everything else on a ship, has to be properly cared for and operated if its is to perform to specification. For crew ratings of competent, crack and elite there is no penalty or bonus because the crew is getting all that the performance that the system can deliver. Novice crews suffer a -3 dB penalty and a poor crew -6 dB.
Extended Examples:
A) Ship vs. Ship - Osa I class PTG against a Spruance class DD.
Environment: Sea State 4 (Clutter = -7dB), clear (ka =0.013 dB/nm), no surface duct
Radars of Interest: Rangout [Square Tie]: SPS-64, SPS-55
Ship RCS:
Osa I RCS = 15.69 x Log (171) - 9.69 = 25 dB
Spruance RCS = 15.69 x Log (7,862) - 9.69 = 51 dB
Radar BPV:
Rangout = 21.7 nm vs. Medium Target (50 dB target)
21.7 = 10^(X/40)
X/40 = 1.336
X = 53.5
BPV = 53.5 - 50
BPV = 3.5
Clutter Rejection = 0
SPS-64 = 40 nm vs. Medium Target (50 dB)
40 = 10^(X/40)
X/40 = 1.6
X = 64.1
BPV = 64.1 - 50
BPV = 14.1
Clutter Rejection = +7
SPS-55 = 50 nm vs. Medium Target (50 dB)
50 = 10^(X/40)
X/40 = 1.7
X = 68
BPV = 68 - 50
BPV = 18
Clutter Rejection = +15
| Radar | BPV | Target RCS | Clutter | Total | Range (nm) |
|---|---|---|---|---|---|
| Square Tie | 3.5 | 51 | -7 + 0 | 47.5 | 15.4 |
| SPS-64 | 14.1 | 25 | -7 + 7 | 39.1 | 9.5 |
| SPS-55 | 18 | 25 | -7 + 15 | 43 | 11.9 |
| Radar | ka | Atten Loss | New Total | Final Range (nm) |
|---|---|---|---|---|
| Square Tie | 0.013 | -0.20 | 47.3 | 15.2 |
| SPS-64 | 0.013 | -0.12 | 38.9 | 9.4 |
| SPS-55 | 0.013 | -0.15 | 42.85 | 11.8 |
Note 1: Many of the H 4 ranges for a medium target are too pessimistic. The range for the Rangout [Square Tie] radar corresponds to Russian source data. US radar data is much too pessimistic. A review of military SS radars show a maximum instrumented range varying between 35 and 50 nm. Also, a lot of the open press articles assume a destroyer-size (40 - 50 dB) target. For database purposes, recommend treating the SS Large column in H4 as the range for a Medium-size target (50 dB) when determining the BPV.
Note 2: If the Osa I had a less than competent crew, the range would decrease accordingly to 12.8 nm for a Novice crew and 10.8 nm for a Poor crew.
Note 3: If the Osa I were to transit near (2 nm) the coastline, then the Spruance would see a -17 dB of clutter from the beach vice the -7 dB from the sea surface. The Å in the earlier equation means a power sum of the two signa-tures. The easiest way to do a power sum is to subtract the smaller value from the larger and compare the results to the following table.
| Difference between sources | Power Sum Value |
|---|---|
| 0 - 1 dB | +3 dB |
| 2 - 4 dB | +2 dB |
| 5 - 8 dB | +1 dB |
| 9+ dB | 0 dB |
Since the sea clutter is 10 dB lower (17 dB - 7 dB = 10) than the land clutter, the power sum value to add to the larger source is 0 dB. In this example, the SPS-64 would suffer an additional -10dB that would bring its total to 29.1 dB (w/o attenuation) which gives a range of only 5.3 nm! The SPS-55 fairs better because of its higher clutter rejection value and sees only a 2 dB reduction to 41dB for a range of 10.6 nm (w/o attenuation).
B) Ship vs. Air - Fregat-MR-710 [Top Plate] vs. F-18C/D and F-18E/F
Environment: Clear (ka =0.008 dB/nm)
Radar of Interest: Top Plate
Aircraft RCS:
F-18C/D RCS = +5 dB (Small) (Nose-on Aspect)
F-18E/F RCS = -10 dB (Low Observable) (Nose-on Aspect)
Radar BPV:
Top Plate = 70.2 nm vs. Small Target (8.5 dB target) -Russian
source data
70.2 = 10^(X/40)
X/40 = 1.85
X = 73.9
BPV = 73.9 - 8.5
BPV = 65.4
Clutter Rejection = 49 dB (This is huge and it does include the 6 dB loss term!)
Instrumented Range: 162 nm
| Radar | BPV | Target RCS | Clutter | Total | Range (nm) |
|---|---|---|---|---|---|
| Top Plate | 65.4 | 5 | None | 70.4 | 57.5 |
| Top Plate | 65.4 | -10 | None | 55.4 | 24.3 |
| Radar | ka | Atten Loss | New Total | Final Range (nm) |
|---|---|---|---|---|
| Top Plate | 0.008 | -0.46 | 69.9 | 55.9 |
| Top Plate | 0.008 | -0.2 | 55.2 | 24.0 |
Note 1: The performance data above is considerably lower than Harpoon 4 . A small aircraft has a detection range of 88 nm and a VSmall a range of about 40 nm. Also note that the maximum range of 220 nm is also off considerably.
Note 2: The very large clutter rejection term has been verified with Russian radar brochures - they do believe that they can get 55 dB! This is probably driven by a chaff rejection requirement.
C) Air vs. Air - APG-71 vs. SS-NX-25 (sea skimming ASCM)
Environment: Sea State 3 (Clutter = -31 dB), Clear (ka =0.013 dB/nm)
Radar of Interest: APG-71
Missile RCS: SS-NX-25 RCS = -10 dB (Low Observable) (Nose-on Aspect)
Radar BPV: APG-71 = 115 nm vs. Small Target (7 dB target) - US source data
115 = 10^(X/40) X/40 = 2.06 X = 82.4
BPV = 82.4 - 7 = 75.4
Clutter Rejection = 25 dB
Instrumented Range: 160+ nm (Harpoon 4 gives 180 nm)
| Radar | BPV | Target RCS | Clutter | Total | Range (nm) |
|---|---|---|---|---|---|
| APG-71 | 75.4 | -10 | -31 + 25 | 59.4 | 30.5 |
| Radar | ka | Atten Loss | New Total | Final Range (nm) |
|---|---|---|---|---|
| APG-71 | 0.013 | -0.4 | 59.0 | 29.9 |
Ed Note: In the course of designing the model for SSI's computer H4 , we've all gotten smarter about radar performance. We won't change the rules, but look for update/corrected Annexes J and L in a future Naval SITREP.
BT
Back to The Naval Sitrep #17 Table of Contents
Back to Naval Sitrep List of Issues
Back to MagWeb Master Magazine List
© Copyright 1999 by Larry Bond and Clash of Arms.
This article appears in MagWeb (Magazine Web) on the Internet World Wide Web.
Other military history articles and gaming articles are available at http://www.magweb.com