In converting a fire resolution procedure for a wargame from one in which a die is rolled for each firing soldier to one in which a single die roll determines the number of enemy soldiers hit, I had to do some detailed statistical analysis. I found the process interesting and the results pleasing. This article describes (briefly) this analysis. For readers with significant statistical background this article may serve as a review. For those with little statistical background this article may seem too technical. My hope is that a few readers who enjoy game design may find this article interesting and a springboard to their own analysis and design work.
As someone who has been designing wargames since the sixth grade (I am much older than that now), a pet peeve of mine is game designers who do not research a period or conduct analysis during the design process. This may be good for homegrown rules meant only for club play, but when a designer publishes rules, claiming some level of historical accuracy, and expects someone to buy the rules, I think the designer owes the customer more than that.
Having said that, when Chris Palmer and I designed G.A.S.L.I.G.H.T. (Glorious Adventures in Science Loosely Involving Generally Historical Times), we made little claim to accuracy; we were looking for a more "cinematic" feel. We were trying to make a fun game based on our vision of Victorian science fiction. (The rules actually work pretty well for colonial era games without all the science fiction elements.) As often happens, however, players quickly tried to use G.A.S.L.I.G.H.T. for games other than for which they were designed. G.A.S.L.I.G.H.T. is essentially a skirmish game, but we found people trying to run larger-scale tactical battles using the rules. Since G.A.S.L.I.G.H.T. was not designed for battles, these players quickly observed that G.A.S.L.I.G.H.T. was inappropriate for them. Right. They are. No surprises there.
So Chris, Rob Beattie, and I began working on Battles by G.A S.L.I.G.H.T., a set of rules based on G.A.S.L.I.G.H.T. that would allow players to fight larger battles. We wanted the two games to have the same "feel," since players of G.A.S.L.I.G.H.T. like the feel of the original rules. Another design goal was to ensure that both sets of rules treat Main Characters (leaders), weapons, vehicles, creatures, and Extras (soldiers) in the same manner. In other words, a player could use a Main Character from the skirmish game as a leader in the tactical game without modifying the Main Character's attributes.
In G.A.S.L.I.G.H.T. each firing soldier rolls 1d10. If the number rolled is less than the firing soldiers' Shoot number, the shot is a hit. (The game master defines the Shoot number, with recommendations for ratings found in the G.A.S.L.I.G.H.T. rulebook. Better units generally have better Shoot numbers.) A unit can consist of as many as ten men. In streamlining the mechanics of G.A.S.L.I.G.H.T. to facilitate larger games, we wanted to have one die roll, rather than ten, to resolve fire combat. In converting the individual die rolls to a single die roll my goal was to try to keep the same chance of ten mk;n inflicting one casualty, two casualties, three casualties, etc. the same between the two systems.
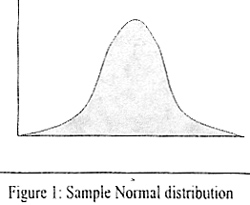
Often in the construction of simulations, analysts try to make the data match a ,probability distribution. The probability density functions describe the probabilities of certain values. The most well known probability density function outside the statistical and simulation communities is the Normal distribution, often referred to as the "bell curve." Other common distributions in simulation include Log Normal, Exponential, Gamma, and Wiebull distributions. In a Normal distribution shown in Figure 1, see how the probability of a value along the horizontal axis is greater toward the center of the curve (denoted by the increased height of the curve) than at either "tail."
 Figure 1: Sample Normal distribution
The probability distribution that describes the results of rolling some number of twenty-sided dice to get a certain number of successes is the Binomial distribution. The formal mathematical formulation of the Binomial distribution is B(n,c,p) = (n/x) * p (to exponential "x") * (1-p) (to exponential "n-x") where n is the number of possible trials (e.g., ten soldiers shooting), x is the number of successes (e.g., four soldiers hit), and p is the probability of success (e.g., Shoot number minus one, divided by twenty).

The term (n/x) is the number of combinations of n objects chosen x at a time (e.g., how many ways can we choose four successes from ten firing soldiers).
As an example of n , the first, second third, and fourth rolls could be hits; the first, third, fourth, and Fifth could be hits; the second, third, fourth, and fifth could be hits; etc.) The value of (10/4) is 210.
If a soldier's Shoot number is 12, the probability of a hit (p in the Binomial formula) is 0.55 (success is rolling less than the Shoot number). To provide an example of the use of this formula, if ten men with Shoot numbers of 12 are firing at an enemy, the chance of hitting exactly 4 enemy soldiers is (10/4) * 0.55 (to 4th power) * 0.45 (to 6th power) = 0.16
- [that's 210 * 0.091506 * 0.003304 = 0.159565).
If one computed this Binomial distribution for zero, one, two... ten hits. the eleven results will sum to LO (with a little round off error due to the imprecision of floating point numbers in digital computers). It is important that you confirm that the values sum to 1.0 to make sure you have not made a mistake!
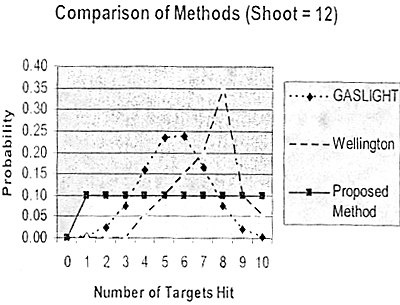
I computed the chances of getting zero to ten hits with one to ten firing soldiers when the firing unit has Shoot numbers between two and eighteen, inclusive. This gave me a set of probability distribution curves that looked like Figure 2.
In figure two, "G.A.S.L.I.G.H.T." refers to the distributions computed as described in the previous paragraph. The following paragraphs will describe "Wellington" and "Proposed Method." Note that in Figure 2 the three distributions do not match well.
 Figure 2: Comparison of three different casualty computation methods.
"Proposed" method was a mechanic that said, "Roll 1d1O and subtract the number of figures missing. The unit's Shoot number minus the modified die roll is the number of enemy soldiers killed." It turns out that this method rarely matches the Binomial distribution describing the original G.A.S.L.I.G.H.T. system and that after five or six soldiers are missing, depending on the unit's Shoot number, the unit cannot hit any targets any more.
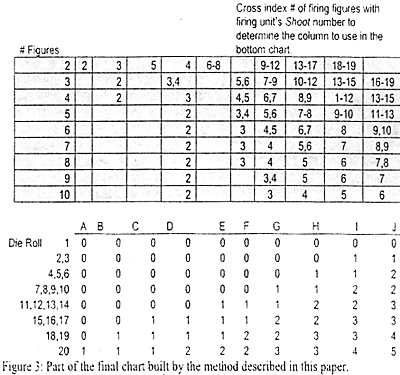
"Wellington" refers to the Wellington Rules system. Wellington Rules is a set of tactical Napoleonics rules. The bottom half of Figure 3 shows a portion of the Wellington Rides chart. The die roll column is a discrete approximation of a Normal distribution (i.e., belt curve) so that the "middle" results are more common than the "best" or "worst" results. I did this because the "Law of Large Numbers" indicates that a sufficiently larger number of occurrences will eventually look like a Normal distribution. Once I determined that the "Proposed" method was unsuitable, I set about trying to match columns in the Wellington Rules chart to the Binomial distributions describing the original G.A.S.L.I.G.H.T., multiple dice method.
In converting from the multiple dice method to the single die method, none of the columns in the Wellington Rides chart matched exactly. The methodology that I used was to compute a Binomial distribution for each combination of Shoot number, number of firing soldiers, and number of hits. I used a commercial spreadsheet software package to assist with this analysis. I compared each combination to each column in the Wellington Rules chart and computed a sum of squared errors (SSE):

Where Wellington; is the probability of, hits in the Wellington Rides chart and G.A.S.L.I.G.H.T., is the probability of i hits using the original G.A.S.L.I.G.H.T. method. I then chose the column with the smallest SSE, because the smallest SSE indicates the smallest difference between the two systems. (This method squares the errors so that all errors are positive numbers.) In doing this analysis I favored columns that indicated fewer hits than the original G.A.S.L.I.G.H.T. system to compensate for the fact that all shots are not independent (see below).
Figure 3 depicts a portion of the chart developed from this analysis. The player finds the number of firing figures in the left column of the top chart. The player then follows that row to the right to a cell with the firing unit's Shoot number. This cell determines the column used in the bottom chart. The player rolls a twenty-sided die and finds the roll in the left column of the bottom chart. Cross-index the row indicated by the die roll with the column determined in the top chart. The result is the number of enemy soldiers hit by the firing unit.
 Figure 3: Part of the final chart built by the method described in this paper.
I wanted to use something like the Wellington Rides chart for simplicity. When computing the Binomial distributions, each Shoot number results in slightly different numbers for zero hits, one hit, etc. To be completely bound by the results of computing the Binomial distributions, each Shoot number would require its own chart, which would make the game less playable. As an example, see how live firing soldiers use the same column (column J) with Shoot numbers of eleven, twelve, and thirteen in the top chart in Figure 3. None of the actual Binomial distributions computed for five firing soldiers with Shoot numbers of eleven, twelve, and thirteen exactly match the probabilities shown in column J of the bottom chart in Figure 3, but they match closely enough for a wargame. (During the process of this analysis, I found that I needed to create some additional columns, particularly at the left end of the chart, in order to match better the original G.A.S.L.I.G.H.T. distributions.)
So why go through all this? It is often easy to find/develop/assume/guess the probability that a single soldier will hit an enemy target given certain circumstances. In modem military science there is a term known as "maximum effective range," which is the distance at which an average soldier has a 50% chance of hitting a man-size target. Of course, no one fires as well in combat as they do on a firing range, but maximum effective range gives you a good starting point. When developing the combat resolution chart for Beer and Pretzels Skirmish, I cut maximum effective range by 75% (i.e., I used one quarter of maximum effective range as the range at which a soldier has a 50% chance of a hit. Given some percent chance of an individual soldier getting a hit, anyone can use a commercial spreadsheet package and the Binomial distribution to build a single-die-roll combat resolution table.
Of course, this methodology assumes that each soldier's shot is independent. In other words, this methodology ignores the likely possibility that two firing soldiers might hit the same enemy target. As a result, the number of enemy soldiers hit in a gaming environment is probably a little higher that realistic. A game designer needs to temper the results of the statistical analysis with what "feels right" to compensate for many of the intangible aspects of war that the statistical analysis often cannot easily replicate: fear, smoke, multiple hits on the same target, training, weapons jamming, etc. Also a game designer often has to modify the results of this analysis to make the game more fun. The designer should make these modifications, however, after thorough analysis, not instead of that analysis.
The game designer should resist the temptation to supply too many modifiers (e.g., to the die rolls or, in the case of Wellington Rules, column shifts). Our empirical knowledge of battle effects is imprecise, because many of the observers are killed, much of the equipment is destroyed, and sometimes the terrain is modified by a battle. In addition, two armies are unlikely to re-fight the exact same battle forty or fifty times in order to gather enough data from which to make statistically significant inferences. Many game designers supply dozens of modifiers creating the illusion of precision that is just not possible. Often the designer adds many of these modifiers during play testing to compensate for events that happen occasionally. Remember that we are using dice to generate random numbers and that over the course of a game many die roll results (as well as player decisions) contributed to the current state of the game. Each modifier the game designer adds makes the game a little more complicated, contributes to the illusion of precision, and often spawns one or more additional modifiers. (Minimizing the number of modifiers has two additional advantages: 1) it helps the game charts to fit on a single card and 2) it helps the game master avoid "Trivial Pursuit" games with players.)
One of the advantages of using twenty-sided dice is that each +1 or -1 modifier has the effect of changing the chance of success by 5%. I do not think that any designer should include modifiers that have less than a 5% impact on the results of combat. In Battles by G.A.S.L.I.G.H.T. there are only two modifiers (as column shifts on the bottom chart in Figure 3) based on the cover status of the target unit. We are considering adding a third modifier if the target is in a dense formation. Wellington Rides, which is meant to be more "realistic," has many more modifiers, but I have tried to include as few as possible. The rule of thumb that I use is "will this modifier help distinguish something that should be distinguished at this level of abstraction?"
Clearly, in a set of Napoleonics rules we want to distinguish between heavy and light cavalry. Do we need more modifiers for medium cavalry? Medium cavalry is not a designation used in Napoleonic armies, and I think no modifier for this is needed. Do we really need a modifier for the combat effects of the 33rd Imperial Werewolf Division between 1806 and 1809 in the rules, or is this essentially a scenario design issue?
The point of this article was to demonstrate a methodology that can be used in the design of wargames. Many readers will find this methodology "high hat," "too academic," "too hard," or "too `simulation' and not enough `game'." As mentioned at the beginning of this article, I get frustrated when game designers base their designs totally on what "feels right" with little concern for analysis. In writing and publishing wargames and running demonstration games at many conventions over the past twenty five years, I have run into many "experts" who have often read no more than a single book on the topic at hand and merely base their "expertise" on what they liked or disliked about someone else's game designs. In demonstrating this methodology, however, I hope to show that "too hard" should not be used as an excuse for laziness on the pact of game designers who make claims of historical accuracy. In many cases, in fact, spending time doing good analysis will often helps make the game more playable as well as more realistic.
Back to Dispatch October 2002 Table of Contents
Back to Dispatch List of Issues
Back to MagWeb Master Magazine List
© Copyright 2002 by HMGS Mid-South
This article appears in MagWeb (Magazine Web) on the Internet World Wide Web. Other military history articles and gaming articles are available at http://www.magweb.com